
Retention - the GOAT of all metrics!
the metric to really focus on...

In my previous post on Growth 101, we discussed two key things -
A. What the ideal growth funnel looks like?

B. And what are the three key questions to answer for any growth leader?
What is my acquisition model - how do I get more users on the product?
What is my retention model - how do I retain the users that I have acquired?
What is my monetization model - (eventually or right off) how do I make money from the users that are using my product?
Today, I want to focus on the most important metric that you should care about, irrespective of the stage of your company, RETENTION. Loosely defined as the number of users actually staying back and “using” your product over and over again.
The inspiration comes from this tweet by Lenny on what would be good and great growth rates by company stage.


While I would definitely recommend checking out the entire tweet, the key takeaway for me was that at early stages, revenue growth rates don’t really make a lot of sense because the base values are just so small.
What therefore is important is to find out other metrics that can give you a leading indication of what is actually happening in the company. And as Lenny quotes Rebecca from Union Square Ventures -
Revenue growth is really an output for what else is happening in the business—basically how much customers love the product and how efficient it is to get more of them. Cohorted revenue retention and/or purchase behavior (ideally U-shaped cohorts where net revenue retention goes up over a year) and marketing spend/revenue (efficiency) are the most important factors to the health and velocity of a business.
This now brings us to the meat of our discussion - if you can focus on any on thing, focus on RETENTION. I repeat, always solve for retention. Find people who love your product, no matter how niche they are, and think of ways to scale it up.
Let’s jump right in!
Why is retention important?
Retention is not just about losing fewer users. It also affects the other two key questions that growth leaders should be thinking about -
Acquisition
focusing too much on acquisition while having poor retention has been called the leaky bucket problem. You might be able to generate hundreds and thousands of new users, but poor retention essentially translates to holes in your product funnel “bucket”.
improving retention also improves word of mouth viral growth by existing satisfied users, leading to more users and more retention.
Monetization
very simply, more retained users allow you to have a higher chance of converting them to paid users
additionally, more retention → more LTV → allows you to increase your CAC → get access to tough to crack customers, outspend your competition etc.
In our first post, we discussed how growth and PMF can actually start “parallely” in this increasingly competitive and attention-starved world. One of the most beautiful benefits of retention is the ability to signal if you have the mystical Product Market Fit!
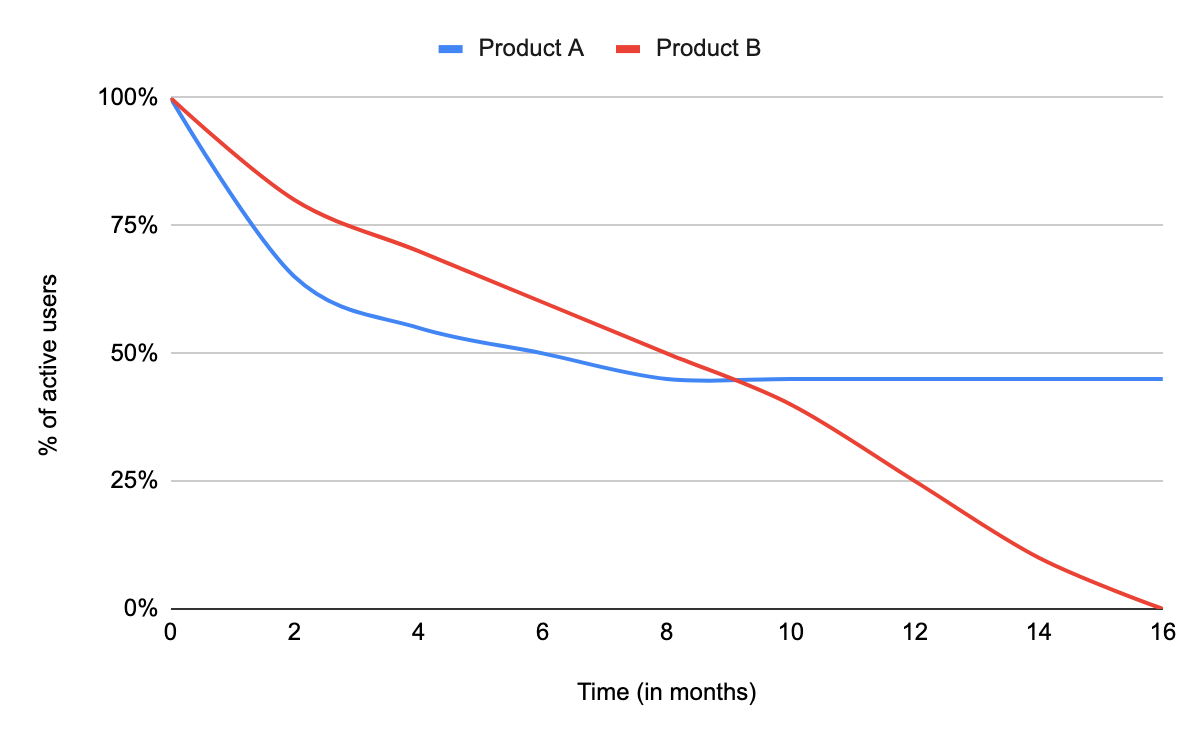
In the below graph, for e.g., even though Product B showed higher retention rates in the initial months, the inability to retain their active users eventually led to a decline in the long run for their user base. Product A on the other hand had a (very typical) decline in their active users, but managed to flatten their “retention curve” over time and enjoyed love from a loyal and active customer base.
Sorry, but what is a retention curve??
Ah yes, here we go.
Define your cohort of users
A retention curve is typically prepared for a cohort of users. The cohort could be anything - source of users (PR campaign, SEO etc.), type of user (title, location, persona etc.), timing of user (signed up in June v/s December), or literally any other criteria (switching from a competitor, responded to cold email etc.)
Define what retention means for you
Once we have defined our cohort, we start measuring what % of that cohort is actually staying back and “using” the product. Now this is where things get subjective. You get to define what is the “usage” of your product. For a stock management company, it could be purchasing one stock or mutual fund every month, whereas for a gaming company, it could mean playing at least one game for 5 mins every alternate day. The point is you know your business best to be able to define what classifies as usage of your product.
Plot the curve
Once we have defined the cohort and usage, it’s time to get to the plot. The y-axis typically gets the % of active users and the x-asis gets the time. As you can imagine, the x-axis will have to be defined for your product’s use case - a gaming company, for e.g., will want to see daily usage and not monthly.
The most important thing about a retention curve is that it HAS to flatten out eventually. If a retention curve does not flatten out, it means that theoretically at one point, you will lose all your users.
A set of these retention curves for different cohorts eventually translates to the cohort analysis. Let’s take an example -
We have a workspace collaboration tool (think Slack?) that is just starting out and we want to absolutely nail our ideal customer persona (ICP). Our initial usage analysis shows that engineering leaders and product leaders could be two ICPs to target. A cohort analysis way of thinking will lead us to do the following -
Compare retention curves of these two ICPs, while trying to keep everything the same:
Define the cohort: Let’s say I pick up 20 users from each of the engineering managers & product managers customer persona who signed up in the month of January.
Notice that we are picking up a fairly small customer base of 20. While you would ideally want this number to be higher, you will not always have that luxury in an early stage company!
Define what is retention: For our workspace collaboration tool, let’s define retention as users who send at least 10 messages to two unique users over the course of one week.
Plot the curve: Plot the retention curves of these two ICPs - % of active users from the 20 base on the y-axis and the time period on the x-axis. From step 2, let’s keep the time period as one week, monitored over a course of 6 weeks.
With resources and time of the essence in any startup, analyzing these 2 retention curves can help us prioritize a particular ICP and really go after them (to prove OR disprove our hypothesis of them being the first ICP). As mentioned earlier - find people who LOVE your product - focus on the niche!
Do a cohort analysis of the prioritized ICP
Having chosen a particular ICP, the next step is to identify what channel/tactic/sub-persona will really work for us. Here are two ideas to take the analysis forward:
Identify which marketing channel is working: E.g. engineering managers that came in through a paid Google ad v/s those that came in through a referral. Essentially comparing between people who were consciously searching for a workplace collaboration tool v/s people whose network thought that they could use such a tool. A cohort analysis comparing these 2 cohorts could guide as where to focus our marketing efforts
Identify which product changes are working: Let’s say we rolled out 2 major product changes in a span of 3 weeks (e.g. full-fledged search v/s integration with GitHub). A cohort analysis of users that came in after those product changes can help us identify if the particular changes are actually helping us improve our most favorite metric - retention.
Plotting the retention curves of these 2 cohorts and seeing which one is flattening out at a higher number is a clear way to understand which product feature should the team actually be focusing on!
Good place to notice that retention can actually be a north star metric for both marketing and product facing growth teams and be used across the organization.
Retention is not just the responsibility of a particular team but should be considered sacred across the organization!
Okay, so recap time:
If you can focus on any one metric, let it be retention. Find that niche set of users that loves you and then scale.
Use retention curves to find which ICP to focus on and then again to prioritize marketing and growth experiments - keeping retention the star of your show!
Aspirational retention benchmarks
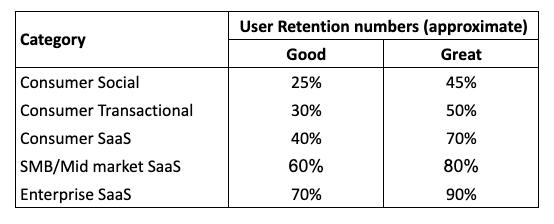
Now that you understand retention and how to measure it, it is key to understand what is bad, good and great in this world. Thankfully, the internet has already done this for you (and saved me some time :) ).
Casey Winters (CPO at Eventbrite and a Partner at Reforge) did a detailed study on what is good and great retention across different industries. To not reinvent the wheel, here’s the entire article on Casey’s blog and the supporting pdf of the metrics if you want to quickly get to the numbers.
For all those interested in the tl;dr, here’s the short summary:
What else do you need to know about retention?
As is the theme of this newsletter, let’s get to some more actionables that you can use right away:
What all can I do about my retention?
Identify the correct unit of measurement - in an early stage company that will ideally not be revenue because it is lagging indicator and not a leading one. Instead think usage, activation, etc.
Identify the correct frequency of measurement - you don’t want to be a gaming company measuring retention monthly. Understand what is best for your industry.
Understand core actions that will influence retention - magic moments, stable product, app v/s website only etc.
Which all retention metrics are important?
Short-term retention (day 2, week 1 etc.) - are users getting core value as quickly as possible from the product?
Most important retention metric - make or break in the attention-deprived world.
Mostly no user will re-open a app they were dissatisfied with once.Mid-term retention (day 7, week 4 etc.) - are users creating habits around the core value of the product?
Long-term retention (month 1, month 6 etc.) - are users experiencing core value as often as possible?
How to improve the short-term retention?
Given short-term retention is clearly the most importance metric, it is important to make it a priority. Quick tips to focus on as you think about your particular product:
Separate new user experience from returning user (make onboarding special)
Segment experience based on user persona - can you show something different to an engineer v/s a marketing person?
Leverage different ways to make the experience magical - demo video, walkthrough tour, sample docs etc.
That’s it - all that you need to know about retention ti be a better operator - LFG to the moon! 🚀 I will be back next week with another growth article - do subscribe (and share this with your friends & peers) if this is helpful!
Why am I doing this?
To The Moon is my effort to contribute to the growth ecosystem and document my learnings along the way! My current role involves all things growth at an early stage startup and every day brings with it so much learning and excitement that I just cannot NOT share it.
If you are at an early or late stage company in a growth, marketing, product or business development role, I believe my posts can be of value to you. Every week I intend to cover one key growth topic in detail along with actionable insights that you can start using right away.
About me
I am currently handling all things growth at an exciting young startup called Almanac.io. We are a modern age platform for async collaboration with a mission to redefine how work happens in today’s distributed world.
Previously, I was Chief of Staff to the CEO at another SaaS startup called Last9.io and before that, I spent 3 years at McKinsey & Company, advising large tech players on their growth and product strategy.
You can find me on Twitter and LinkedIn. Drop by and say a Hi!